Introduction
Digital Experience Monitoring DEM helps organizations measure how users experience websites, applications, networks, devices, APIs, SaaS tools, and digital services. In simple words, DEM shows whether employees, customers, partners, and digital agents can access applications quickly, reliably, and smoothly from their real locations, devices, networks, and browsers.
DEM matters because modern business depends on digital performance. A slow login page, broken checkout flow, poor SaaS application performance, unstable VPN connection, failed API, or regional network delay can directly affect revenue, employee productivity, customer satisfaction, and brand trust. Traditional infrastructure monitoring only shows whether systems are up. DEM goes further by showing what the user actually experiences.
Real-world use cases include:
- Website and web application performance monitoring for customer-facing digital services
- Employee digital experience monitoring for remote workers, devices, SaaS apps, and collaboration tools
- Synthetic transaction monitoring for login, checkout, search, payment, and multi-step journeys
- Real user monitoring for actual user sessions, browsers, locations, and performance issues
- Network path visibility for diagnosing ISP, DNS, CDN, cloud, and routing problems
- SaaS application performance monitoring for tools like collaboration, CRM, ERP, and productivity platforms
- API and service availability monitoring for customer journeys and backend dependencies
Evaluation Criteria for Buyers:
- Real user monitoring coverage
- Synthetic monitoring capability
- Network and internet path visibility
- Endpoint and device experience monitoring
- Application and API performance insight
- AI-assisted root cause analysis
- Alerting and incident workflow integration
- Dashboards and executive reporting
- Ease of use for IT, DevOps, and support teams
- Security, permissions, and governance controls
Best for: Digital Experience Monitoring DEM is best for IT operations teams, DevOps teams, SRE teams, network operations teams, customer experience teams, digital product teams, enterprise IT teams, managed service providers, and organizations that need to understand performance from the user’s point of view.
Not ideal for: DEM may not be ideal for very small businesses with simple websites, low digital traffic, or no complex application and network dependencies. In those cases, basic uptime monitoring, website analytics, or standard help desk reporting may be enough.
Key Trends in Digital Experience Monitoring DEM
- User-centric observability is becoming more important because teams need to understand actual digital experience, not just server health.
- Synthetic and real user monitoring together are now essential because synthetic checks find issues before users notice them, while real user data shows actual experience.
- Employee digital experience monitoring is growing as remote and hybrid teams depend heavily on SaaS apps, endpoint health, Wi-Fi, VPN, and collaboration tools.
- Network path visibility is becoming critical because many performance issues happen outside the data center across ISPs, CDNs, DNS, cloud networks, and SaaS providers.
- AI-assisted root cause analysis is helping teams reduce alert noise and identify whether the problem is application, device, network, cloud, or third-party service related.
- SaaS monitoring is becoming a major requirement because business teams depend on external applications that internal IT teams do not fully control.
- Digital journey monitoring is replacing simple page-level monitoring because teams need to test complete user flows such as login, checkout, account creation, and payment.
- Experience-level reporting is becoming more valuable for executives because digital performance affects productivity, revenue, customer satisfaction, and service quality.
- Integration with ITSM, APM, observability, and incident tools is now expected so DEM alerts can become actionable workflows.
- Privacy-aware session and experience analytics are becoming more important as companies monitor user journeys while protecting sensitive customer and employee data.
How We Selected These Tools
The tools in this list were selected based on their relevance to digital experience monitoring, synthetic monitoring, real user monitoring, endpoint experience monitoring, network visibility, SaaS performance monitoring, application observability, and user journey analytics. The goal is not to name one universal winner, but to help buyers compare credible platforms by use case, environment, and team maturity.
Selection factors include:
- Market recognition in DEM, observability, APM, network monitoring, or digital employee experience
- Support for synthetic monitoring, real user monitoring, and user journey tracking
- Ability to diagnose application, network, endpoint, SaaS, and cloud performance issues
- Integration with ITSM, incident management, observability, DevOps, and collaboration tools
- Suitability for SMB, mid-market, enterprise, SRE, IT operations, and customer experience teams
- Reporting depth for technical teams, support leaders, executives, and product teams
- Automation support for alerts, anomaly detection, and root cause analysis
- Security, role-based access, auditability, and governance signals
- Ease of use for IT, DevOps, support, product, and operations users
- Implementation support, documentation, ecosystem maturity, and scalability
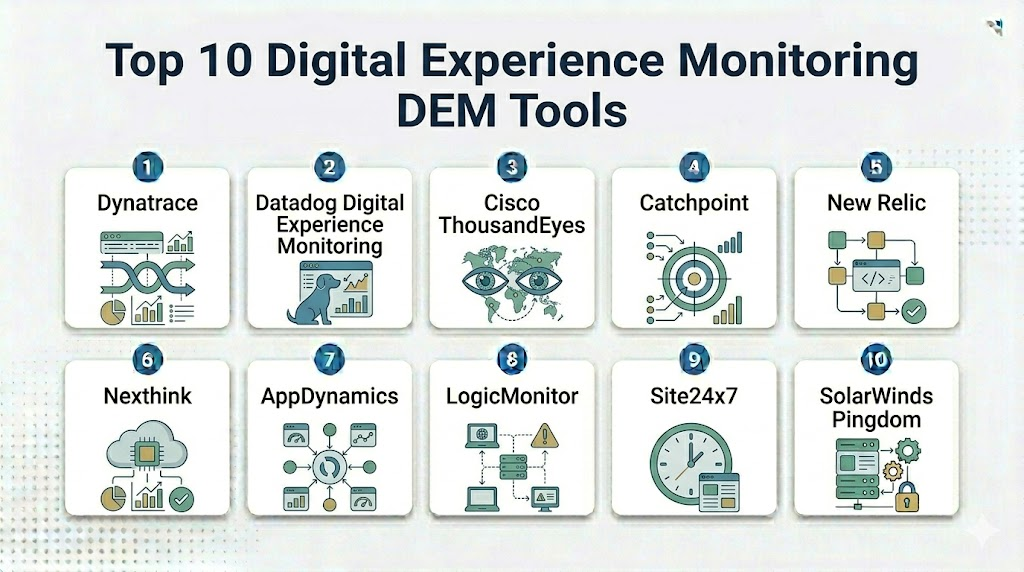
Top 10 Digital Experience Monitoring DEM Tools
1- Dynatrace
Short description: Dynatrace is an observability and digital experience monitoring platform that helps teams monitor applications, infrastructure, real users, synthetic journeys, and service dependencies. It is well suited for enterprises that need deep root cause analysis across complex digital environments.
Key Features
- Real user monitoring for web and mobile applications
- Synthetic monitoring for critical journeys
- Application performance monitoring and infrastructure visibility
- AI-assisted root cause analysis
- Full-stack observability across cloud and hybrid environments
- User session and experience analytics
- Dashboards, alerts, and service-level reporting
Pros
- Strong fit for large and complex digital environments
- Powerful root cause analysis across applications and infrastructure
- Useful for connecting user experience with backend performance
Cons
- Can be complex for smaller teams
- Pricing and setup may require careful planning
- Best value depends on broad observability adoption
Platforms / Deployment
Web / Cloud / Hybrid options vary / Mobile access varies
Security & Compliance
Dynatrace supports enterprise environments where secure access, role-based permissions, auditability, encryption, and governance are important. Specific controls such as SSO, MFA, audit logs, data residency, and certifications should be verified directly with the vendor. Not publicly stated for every configuration.
Integrations & Ecosystem
Dynatrace integrates with DevOps, ITSM, cloud, CI/CD, collaboration, incident response, and observability workflows. It is useful when DEM must connect user experience with infrastructure, services, logs, traces, and incidents.
Common integration areas include:
- Cloud platforms
- ITSM systems
- Incident management tools
- CI/CD pipelines
- Collaboration platforms
- Observability and logging tools
Support & Community
Dynatrace provides enterprise support, documentation, training, implementation partners, community resources, and observability guidance. Support depth depends on package, customer agreement, and deployment scope.
2- Datadog Digital Experience Monitoring
Short description: Datadog Digital Experience Monitoring helps teams monitor frontend performance, real user sessions, synthetic tests, mobile experiences, browser performance, and application dependencies. It is useful for cloud-native teams that want DEM connected with infrastructure, APM, logs, and security data.
Key Features
- Real user monitoring for web and mobile apps
- Synthetic monitoring for APIs and user journeys
- Session replay and frontend performance insights
- APM, logs, infrastructure, and network correlation
- Alerting and dashboarding
- Error tracking and user impact visibility
- Broad integration ecosystem
Pros
- Strong fit for DevOps and cloud-native teams
- Good correlation across user experience, infrastructure, and application data
- Large integration ecosystem and flexible dashboards
Cons
- Costs can increase as modules and data volume grow
- Initial setup may require careful tagging and instrumentation
- Smaller teams may not need the full observability stack
Platforms / Deployment
Web / Cloud / iOS / Android access varies
Security & Compliance
Datadog supports enterprise monitoring environments where access controls, role-based permissions, auditability, encryption, and governance are important. Specific details such as SSO, MFA, audit logs, data residency, and certifications should be verified directly with the vendor. Not publicly stated for every configuration.
Integrations & Ecosystem
Datadog integrates with cloud platforms, containers, databases, APM, logs, CI/CD, incident tools, collaboration platforms, and security workflows. It is valuable when DEM needs to connect with full-stack observability.
Common integration areas include:
- Cloud providers
- Kubernetes and containers
- APM and logs
- CI/CD tools
- Incident response platforms
- Collaboration tools
Support & Community
Datadog provides documentation, support resources, training materials, technical guidance, and a large user ecosystem. Support depth varies by plan and customer agreement.
3- Cisco ThousandEyes
Short description: Cisco ThousandEyes is a digital experience and internet visibility platform that helps organizations monitor network paths, SaaS performance, cloud connectivity, internet health, and application availability. It is especially useful when user experience depends on networks outside direct enterprise control.
Key Features
- Network path and internet visibility
- Synthetic monitoring for web, API, and transaction flows
- SaaS application performance monitoring
- Endpoint agent visibility
- Cloud and ISP dependency monitoring
- DNS, CDN, and routing insight
- Alerting and service delivery dashboards
Pros
- Strong fit for network-centric digital experience monitoring
- Useful for diagnosing internet, SaaS, cloud, and routing issues
- Helps IT teams see beyond internal infrastructure
Cons
- Application code-level diagnostics may require other tools
- Best value comes when network path visibility is a priority
- Some setup requires careful test design and endpoint coverage
Platforms / Deployment
Web / Cloud / Endpoint agents / Enterprise agents
Security & Compliance
Cisco ThousandEyes is used in enterprise network and digital experience environments where access control, data protection, and governance are important. Specific security controls such as SSO, MFA, encryption, role-based access, audit logs, and certifications should be verified directly with Cisco. Not publicly stated for every configuration.
Integrations & Ecosystem
Cisco ThousandEyes integrates with network operations, ITSM, collaboration, observability, incident response, and Cisco ecosystem tools. It is valuable when teams need to correlate user experience with network, cloud, and internet dependencies.
Common integration areas include:
- ITSM platforms
- Network operations tools
- Incident response systems
- Collaboration platforms
- Cloud monitoring tools
- Cisco networking ecosystem
Support & Community
Cisco provides enterprise support, documentation, training resources, implementation guidance, and a large partner ecosystem. Support depth depends on contract and deployment scope.
4- Catchpoint
Short description: Catchpoint is a digital experience monitoring platform focused on internet performance, synthetic monitoring, real user monitoring, endpoint monitoring, API monitoring, and network experience. It is useful for organizations that need global visibility into digital service delivery from many locations.
Key Features
- Global synthetic monitoring
- Real user monitoring
- Endpoint experience monitoring
- API and transaction monitoring
- DNS, CDN, BGP, and internet performance visibility
- Network and application performance diagnostics
- Alerts, dashboards, and service reporting
Pros
- Strong fit for internet performance and global experience monitoring
- Useful for external customer-facing journeys and APIs
- Broad testing coverage across locations and digital dependencies
Cons
- Full value depends on careful monitor design
- May require integration with APM or ITSM tools for complete workflows
- Smaller teams may not need advanced global monitoring coverage
Platforms / Deployment
Web / Cloud / Endpoint agents
Security & Compliance
Catchpoint supports enterprise DEM environments where secure access, permissions, monitoring data protection, and governance matter. Specific controls such as SSO, MFA, encryption, audit logs, role-based access, and certifications should be verified directly with the vendor. Not publicly stated for every configuration.
Integrations & Ecosystem
Catchpoint integrates with incident management, ITSM, collaboration, observability, and performance engineering workflows. It is useful when DEM alerts must trigger operational response across multiple teams.
Common integration areas include:
- ITSM systems
- Incident response tools
- Collaboration platforms
- APM tools
- Status pages
- Network operations workflows
Support & Community
Catchpoint provides documentation, support services, implementation guidance, and digital experience monitoring expertise. Support levels vary by customer agreement and package.
5- New Relic
Short description: New Relic is an observability platform that supports digital experience monitoring through real user monitoring, browser monitoring, mobile monitoring, synthetic checks, APM, infrastructure monitoring, logs, and error tracking. It is useful for engineering and DevOps teams that want user experience data connected with application performance.
Key Features
- Browser and real user monitoring
- Mobile application monitoring
- Synthetic monitoring
- APM and infrastructure correlation
- Error tracking and frontend performance data
- Dashboards and alerting
- Logs, metrics, traces, and user experience insights
Pros
- Strong fit for engineering and DevOps teams
- Useful for connecting frontend experience with backend performance
- Flexible observability platform for modern applications
Cons
- Requires instrumentation and setup discipline
- Costs can depend on data volume and usage
- Employee device experience may require other tools
Platforms / Deployment
Web / Cloud / Mobile access varies
Security & Compliance
New Relic supports observability environments where access control, encryption, permissions, and data governance are important. Specific controls such as SSO, MFA, audit logs, data residency, and certifications should be verified directly with the vendor. Not publicly stated for every configuration.
Integrations & Ecosystem
New Relic integrates with cloud platforms, applications, infrastructure, logs, CI/CD, incident management, and collaboration workflows. It is useful when DEM needs to connect with development and SRE workflows.
Common integration areas include:
- Cloud platforms
- APM and infrastructure tools
- CI/CD systems
- Incident response tools
- Collaboration platforms
- Logging and analytics systems
Support & Community
New Relic provides documentation, support resources, training content, community resources, and implementation guidance. Support levels vary by plan and customer requirements.
6- Nexthink
Short description: Nexthink is a digital employee experience platform that helps IT teams monitor endpoint health, employee experience, device performance, application usage, employee sentiment, and remediation workflows. It is best suited for organizations focused on workforce productivity and endpoint experience.
Key Features
- Endpoint and employee experience monitoring
- Device performance and health analytics
- SaaS and application usage visibility
- Employee sentiment and experience scoring
- Automated remediation workflows
- IT experience dashboards
- Digital workplace analytics
Pros
- Strong fit for employee digital experience monitoring
- Useful for remote and hybrid workforce visibility
- Helps IT teams detect and fix endpoint-related productivity issues
Cons
- Less focused on external customer journey monitoring
- Web synthetic monitoring may require other tools
- Best value depends on endpoint coverage and IT workflow adoption
Platforms / Deployment
Web / Cloud / Endpoint agents
Security & Compliance
Nexthink supports enterprise endpoint and employee experience environments where user data protection, secure access, permissions, and governance are important. Specific controls such as SSO, MFA, encryption, audit logs, data residency, and certifications should be verified directly with the vendor. Not publicly stated for every configuration.
Integrations & Ecosystem
Nexthink integrates with ITSM, endpoint management, collaboration, automation, and workplace technology systems. It is valuable when DEM focuses on employees, devices, applications, and IT support workflows.
Common integration areas include:
- ITSM platforms
- Endpoint management tools
- Collaboration platforms
- Automation workflows
- Security tools
- Digital workplace systems
Support & Community
Nexthink provides enterprise support, onboarding, documentation, customer success guidance, and digital employee experience expertise. Support depth varies by contract and deployment scope.
7- AppDynamics
Short description: AppDynamics is an application performance monitoring and observability platform that helps teams monitor application transactions, business journeys, user experience, infrastructure dependencies, and performance issues. It is useful for enterprises that need application-centric DEM connected with business transaction visibility.
Key Features
- Application performance monitoring
- End-user monitoring capabilities
- Business transaction visibility
- Infrastructure and dependency monitoring
- Root cause analysis support
- Dashboards and alerting
- Integration with Cisco ecosystem
Pros
- Strong fit for application-centric monitoring
- Useful for connecting technical performance with business transactions
- Good option for organizations using Cisco technology environments
Cons
- DEM depth may depend on module and configuration
- Network-focused visibility may require ThousandEyes or other tools
- Setup can require application instrumentation planning
Platforms / Deployment
Web / Cloud / On-premises or hybrid options vary
Security & Compliance
AppDynamics supports enterprise observability environments where secure access, permissions, encryption, auditability, and governance matter. Specific controls such as SSO, MFA, audit logs, data residency, and certifications should be verified directly with the vendor. Not publicly stated for every configuration.
Integrations & Ecosystem
AppDynamics integrates with application, infrastructure, cloud, network, DevOps, and incident workflows. It is useful when user experience analysis needs to connect with application transaction traces and business impact.
Common integration areas include:
- Application platforms
- Cloud environments
- ITSM tools
- Incident management systems
- CI/CD tools
- Cisco ecosystem tools
Support & Community
Cisco provides support, documentation, training resources, implementation partners, and enterprise guidance for AppDynamics. Support levels depend on contract and deployment scope.
8- LogicMonitor
Short description: LogicMonitor is an infrastructure, cloud, network, and application monitoring platform that includes synthetic monitoring and digital experience capabilities. It is useful for IT operations teams that want DEM signals connected with hybrid infrastructure and network visibility.
Key Features
- Infrastructure and network monitoring
- Synthetic monitoring capabilities
- Cloud and hybrid environment visibility
- Website and service availability checks
- Alerting and anomaly detection
- Dashboards and reporting
- Broad integration support
Pros
- Strong fit for IT operations and hybrid infrastructure teams
- Useful for monitoring digital services alongside infrastructure
- Good option for organizations needing broad operational visibility
Cons
- Customer journey analytics may not be as deep as dedicated DEM platforms
- Real user monitoring depth should be validated by use case
- Best suited for IT operations-driven monitoring programs
Platforms / Deployment
Web / Cloud / Collectors
Security & Compliance
LogicMonitor supports enterprise IT monitoring environments where secure access, permissions, encryption, and governance are important. Specific details such as SSO, MFA, audit logs, role-based access, and certifications should be verified directly with the vendor. Not publicly stated for every configuration.
Integrations & Ecosystem
LogicMonitor integrates with ITSM, incident management, cloud, network, infrastructure, and collaboration tools. It is valuable when DEM must sit alongside operational monitoring.
Common integration areas include:
- ITSM platforms
- Cloud providers
- Network systems
- Incident response tools
- Collaboration tools
- Reporting dashboards
Support & Community
LogicMonitor provides documentation, support resources, onboarding assistance, customer success options, and implementation guidance. Support depth varies by plan and agreement.
9- Site24x7
Short description: Site24x7 is a monitoring platform that supports website monitoring, synthetic monitoring, real user monitoring, server monitoring, cloud monitoring, application monitoring, and network monitoring. It is useful for SMB and mid-market teams that want broad monitoring coverage in a practical package.
Key Features
- Website and synthetic monitoring
- Real user monitoring
- Server and cloud monitoring
- Application performance monitoring
- Network monitoring
- Alerting and reporting
- Status pages and user experience visibility
Pros
- Good fit for SMB and mid-market teams
- Broad monitoring coverage across websites, apps, servers, and cloud
- Practical option for teams needing DEM without heavy enterprise complexity
Cons
- Deep enterprise observability may require more advanced platforms
- Employee endpoint experience monitoring may be limited
- Advanced root cause analysis should be validated by use case
Platforms / Deployment
Web / Cloud / Mobile apps available
Security & Compliance
Site24x7 supports monitoring environments where secure access, permissions, and monitoring data protection are important. Specific controls such as SSO, MFA, encryption, audit logs, and certifications should be verified directly with the vendor. Not publicly stated for every configuration.
Integrations & Ecosystem
Site24x7 integrates with ITSM, DevOps, collaboration, cloud, and monitoring workflows. It is useful when teams need alerts and monitoring data connected with operational response tools.
Common integration areas include:
- Cloud platforms
- ITSM tools
- DevOps workflows
- Collaboration platforms
- Status pages
- Reporting dashboards
Support & Community
Site24x7 provides documentation, customer support, onboarding resources, community content, and product guidance. Support levels vary by plan and customer agreement.
10- SolarWinds Pingdom
Short description: SolarWinds Pingdom is a website performance and uptime monitoring tool that helps teams monitor website availability, page speed, transactions, and real user experience. It is suitable for teams that need focused web experience monitoring without a large observability platform.
Key Features
- Website uptime monitoring
- Page speed monitoring
- Transaction monitoring
- Real user monitoring
- Alerts and performance reports
- Public status page support depending on setup
- Global monitoring locations
Pros
- Good fit for website and web application monitoring
- Easy to understand for smaller teams
- Useful for uptime, page speed, and transaction checks
Cons
- Not a full enterprise observability platform
- Endpoint and employee experience monitoring are limited
- Complex root cause analysis may require additional tools
Platforms / Deployment
Web / Cloud
Security & Compliance
Pingdom supports web monitoring workflows where account security, permissions, and alerting controls are important. Specific details such as SSO, MFA, encryption, audit logs, and certifications should be verified directly with SolarWinds. Not publicly stated for every configuration.
Integrations & Ecosystem
Pingdom integrates with alerting, incident response, collaboration, and website operations workflows. It is useful when teams need simple website monitoring connected with response processes.
Common integration areas include:
- Incident management tools
- Collaboration platforms
- Status pages
- Web operations workflows
- Reporting tools
- Notification systems
Support & Community
SolarWinds provides documentation, customer support, product resources, and community content. Support depth varies by plan and customer agreement.
Comparison Table
| Tool Name | Best For | Platform Supported | Deployment | Standout Feature | Public Rating |
|---|---|---|---|---|---|
| Dynatrace | Enterprise observability and DEM | Web / Mobile access varies | Cloud / Hybrid options vary | AI-assisted root cause analysis | N/A |
| Datadog Digital Experience Monitoring | Cloud-native DevOps and SRE teams | Web / Mobile access varies | Cloud | RUM and synthetic monitoring with observability correlation | N/A |
| Cisco ThousandEyes | Network and internet experience visibility | Web / Endpoint agents | Cloud | Internet and network path visibility | N/A |
| Catchpoint | Global internet performance monitoring | Web / Endpoint agents | Cloud | Synthetic and internet performance coverage | N/A |
| New Relic | Engineering-led application experience monitoring | Web / Mobile access varies | Cloud | DEM connected with APM and observability | N/A |
| Nexthink | Employee digital experience monitoring | Web / Endpoint agents | Cloud | Endpoint and workforce experience analytics | N/A |
| AppDynamics | Application-centric enterprise monitoring | Web | Cloud / Hybrid options vary | Business transaction visibility | N/A |
| LogicMonitor | IT operations and hybrid infrastructure monitoring | Web / Collectors | Cloud | Infrastructure monitoring with synthetic checks | N/A |
| Site24x7 | SMB and mid-market web monitoring | Web / Mobile apps available | Cloud | Broad website, RUM, server, and cloud monitoring | N/A |
| SolarWinds Pingdom | Website uptime and page speed monitoring | Web | Cloud | Simple website and transaction monitoring | N/A |
Evaluation & Scoring of Digital Experience Monitoring DEM
The scoring below is comparative and buyer-oriented. It should be used as a shortlisting guide, not as a final purchasing decision. A platform with a lower weighted total may still be the best choice if it matches your user type, monitoring scope, application stack, network complexity, and team maturity.
| Tool Name | Core 25% | Ease 15% | Integrations 15% | Security 10% | Performance 10% | Support 10% | Value 15% | Weighted Total |
| Dynatrace | 9 | 7 | 9 | 8 | 9 | 9 | 7 | 8.35 |
| Datadog Digital Experience Monitoring | 9 | 8 | 10 | 8 | 9 | 8 | 7 | 8.55 |
| Cisco ThousandEyes | 9 | 7 | 8 | 8 | 9 | 9 | 7 | 8.15 |
| Catchpoint | 9 | 7 | 8 | 8 | 9 | 8 | 7 | 8.05 |
| New Relic | 8 | 8 | 9 | 8 | 8 | 8 | 8 | 8.15 |
| Nexthink | 8 | 8 | 8 | 8 | 8 | 8 | 7 | 7.90 |
| AppDynamics | 8 | 7 | 8 | 8 | 8 | 8 | 7 | 7.65 |
| LogicMonitor | 8 | 8 | 9 | 8 | 8 | 8 | 8 | 8.15 |
| Site24x7 | 7 | 9 | 8 | 7 | 8 | 8 | 9 | 7.95 |
| SolarWinds Pingdom | 6 | 9 | 7 | 7 | 7 | 8 | 8 | 7.20 |
How to interpret the scores:
- Core score reflects DEM depth across synthetic monitoring, real user monitoring, endpoint experience, network visibility, application performance, and user journey coverage.
- Ease score reflects usability for IT operations, DevOps, SRE, support, product, and network teams.
- Integration score reflects fit with ITSM, APM, observability, incident response, collaboration, cloud, and DevOps tools.
- Security score reflects visible governance signals and expected controls, not unverified certifications.
- Performance score reflects suitability for large-scale monitoring, global checks, complex environments, and high-volume telemetry.
- Value score reflects practical fit relative to capability, implementation effort, monitoring scope, and expected digital experience impact.
Which Digital Experience Monitoring DEM Tool Is Right for You?
Solo / Freelancer
Solo consultants, independent web performance specialists, and freelance DevOps advisors usually do not need a large enterprise DEM platform. Site24x7, SolarWinds Pingdom, New Relic, or Datadog can be practical depending on whether the focus is website uptime, frontend performance, API checks, or application observability.
For client advisory work, it is useful to understand Dynatrace, Datadog, ThousandEyes, Catchpoint, and Nexthink because these tools often appear in enterprise DEM, SRE, network, and digital workplace projects.
SMB
Small and mid-sized businesses should prioritize easy setup, clear alerts, website performance checks, synthetic monitoring, real user monitoring, and simple dashboards. Site24x7, SolarWinds Pingdom, New Relic, LogicMonitor, and Datadog can be strong options depending on technical maturity.
SMBs should avoid overbuying a full enterprise observability platform before defining the most important digital journeys. The first goal should be to monitor critical websites, login flows, APIs, and user-impacting performance issues.
Mid-Market
Mid-market companies often need stronger real user monitoring, synthetic journey monitoring, cloud visibility, application performance correlation, and incident workflow integration. Datadog, New Relic, Dynatrace, Catchpoint, Cisco ThousandEyes, LogicMonitor, and Site24x7 can be strong candidates.
Mid-market buyers should test real journeys such as login, checkout, search, payment, API calls, and SaaS access. A strong DEM platform should help teams detect issues quickly and understand whether the root cause is application, network, device, browser, or third-party service.
Enterprise
Large enterprises need scalable DEM tools that support global locations, multiple applications, employees, customers, network paths, cloud services, endpoints, SaaS tools, and executive reporting. Dynatrace, Datadog, Cisco ThousandEyes, Catchpoint, Nexthink, New Relic, and AppDynamics are strong enterprise candidates depending on the monitoring focus.
Enterprise buyers should prioritize governance, global monitoring coverage, role-based access, data controls, integration depth, root cause analysis, service-level reporting, and workflow automation. The best enterprise tool is usually the one that fits the organization’s observability, network, endpoint, and ITSM architecture.
Budget vs Premium
Budget-conscious teams should first define the main DEM problem. If the need is website uptime and page speed, a focused web monitoring tool may be enough. If the need is full-stack observability, endpoint experience, network visibility, synthetic journeys, and real user monitoring, a premium platform may deliver stronger long-term value.
Premium platforms are more useful when organizations need AI-based root cause analysis, global synthetic checks, user session analytics, endpoint monitoring, network path diagnostics, and enterprise incident workflows.
Feature Depth vs Ease of Use
Dynatrace and Datadog offer strong enterprise observability depth, but they require thoughtful setup. Cisco ThousandEyes and Catchpoint are strong for internet, network, and global experience visibility. New Relic is useful for engineering-led application experience monitoring.
Nexthink is best when the main goal is employee digital experience. LogicMonitor is strong for IT operations and hybrid infrastructure monitoring. Site24x7 and Pingdom are practical when teams want simpler website, synthetic, and uptime monitoring.
Integrations & Scalability
DEM becomes more powerful when it integrates with ITSM, APM, logs, metrics, traces, incident response, collaboration tools, cloud platforms, network tools, and customer support workflows. Without integration, DEM alerts may identify problems but fail to trigger fast action.
Buyers should test alert routing, incident creation, service ownership mapping, dashboard sharing, synthetic test design, RUM tagging, endpoint coverage, and reporting exports. Integration quality often determines whether DEM becomes an operational advantage or another monitoring dashboard.
Security & Compliance Needs
DEM platforms often collect performance telemetry, user session metadata, endpoint data, URLs, device details, network paths, application traces, and sometimes session replay data. Buyers should evaluate SSO, MFA, encryption, role-based access, audit logs, data masking, privacy controls, data residency, and retention settings.
Security, privacy, IT, DevOps, legal, and compliance teams should review DEM configuration before production rollout. Organizations should pay special attention to session replay, user identifiers, endpoint monitoring, and customer data capture.
Frequently Asked Questions
1- What is Digital Experience Monitoring DEM?
Digital Experience Monitoring DEM is the practice of measuring the availability, performance, and quality of digital services from the user’s point of view. It helps teams understand how customers, employees, partners, or digital agents experience applications, websites, networks, and APIs.
2- Why do businesses need DEM tools?
Businesses need DEM tools because infrastructure may look healthy while users still face slow pages, failed logins, network delays, SaaS problems, or poor endpoint performance. DEM helps teams detect and diagnose issues that directly affect productivity, revenue, and customer satisfaction.
3- What is the difference between DEM and APM?
APM focuses mainly on application performance, code, transactions, services, and backend dependencies. DEM focuses on the user experience across real users, synthetic journeys, endpoints, networks, browsers, SaaS apps, and digital journeys. Many organizations use both together.
4- What is the difference between synthetic monitoring and real user monitoring?
Synthetic monitoring uses scripted tests to check websites, APIs, and user journeys from selected locations before or during user impact. Real user monitoring captures performance data from actual users. Together, they provide proactive checks and real-world experience data.
5- Who uses Digital Experience Monitoring Tools?
DEM tools are used by IT operations teams, DevOps teams, SRE teams, network teams, customer experience teams, digital product teams, support teams, service owners, and enterprise IT leaders who need to monitor digital service quality.
6- How much do DEM tools cost?
Pricing varies by vendor, modules, users, monitored applications, synthetic test volume, real user sessions, data retention, endpoint agents, integrations, and support level. Many platforms use usage-based or custom pricing. Buyers should compare total monitoring scope, not just license price.
7- Can DEM tools monitor employee experience?
Yes, some DEM tools monitor employee experience by measuring endpoint health, device performance, SaaS access, network quality, application responsiveness, and employee sentiment. Nexthink is especially focused on digital employee experience, while other tools may provide endpoint or network visibility.
8- Can DEM tools monitor SaaS applications?
Yes, many DEM tools can monitor SaaS applications using synthetic checks, endpoint telemetry, network path visibility, browser monitoring, and user experience analytics. This helps IT teams detect whether problems are caused by SaaS providers, networks, devices, or internal systems.
9- What are common mistakes when choosing DEM software?
Common mistakes include choosing a tool without defining critical user journeys, ignoring network visibility, failing to involve support teams, and not integrating alerts with incident workflows. Another mistake is collecting too much data without clear ownership and action plans.
10- Is DEM useful for ecommerce businesses?
Yes, DEM is very useful for ecommerce businesses because slow product pages, failed search, broken checkout, payment issues, and regional performance problems can directly affect revenue. Synthetic monitoring and real user monitoring are especially important for ecommerce journeys.
Conclusion
Digital Experience Monitoring DEM helps organizations understand digital performance from the user’s perspective, not just from backend system health. The right platform depends on whether the main goal is customer website monitoring, application observability, network path visibility, employee experience, SaaS performance, or global digital journey tracking. Dynatrace and Datadog are strong for enterprise observability-driven DEM, while Cisco ThousandEyes and Catchpoint are excellent for internet, network, and global experience visibility. New Relic and AppDynamics are strong for application-centric monitoring, Nexthink is focused on employee digital experience, LogicMonitor fits IT operations teams, and Site24x7 or SolarWinds Pingdom are practical for simpler website and synthetic monitoring needs. Buyers should shortlist two or three platforms, test them against real digital journeys, validate integrations, review security controls, and confirm that the chosen tool improves both technical troubleshooting and user experience outcomes.
