Introduction
Application Performance Monitoring (APM) tools help teams track how applications behave in real time, from user requests to backend services, databases, and infrastructure. In simple terms, APM tells you whether your application is fast, slow, or failing—and more importantly, why it is happening.
In modern architectures with microservices, APIs, and cloud-native systems, performance issues can originate from multiple layers. APM tools provide end-to-end visibility using traces, metrics, and logs, enabling teams to diagnose problems faster and improve system reliability.
Common real-world use cases:
- Identifying slow APIs and bottlenecks
- Debugging production issues
- Monitoring user experience across applications
- Tracking performance after deployments
- Optimizing database and service performance
What buyers should evaluate:
- Distributed tracing capabilities
- Metrics, logs, and trace correlation
- Cloud and Kubernetes integration
- Real-time alerting and dashboards
- Ease of instrumentation
- Scalability and cost control
- Security and access controls
- Developer experience
- Integration with DevOps workflows
Best for: DevOps teams, SREs, developers, and enterprises running distributed applications.
Not ideal for: Very small applications with minimal traffic and simple architecture.
Key Trends in Application Performance Monitoring (APM)
- Shift toward full-stack observability platforms
- Adoption of OpenTelemetry-based instrumentation
- Integration of AI-driven anomaly detection
- Growing need for frontend-to-backend visibility
- Expansion of cloud-native monitoring capabilities
- Focus on real-time insights and faster debugging
- Increased importance of cost control for telemetry data
- Integration with CI/CD and DevOps pipelines
- Rise of profiling integrated with tracing
- Enhanced security and compliance monitoring
How We Selected These Tools (Methodology)
- Industry adoption and reputation
- Strength of APM core capabilities
- Integration with cloud and DevOps tools
- Scalability for modern architectures
- Ease of use and onboarding
- Security and compliance features
- Flexibility in deployment models
- Innovation in monitoring and analytics
- Community and enterprise support
- Suitability across team sizes
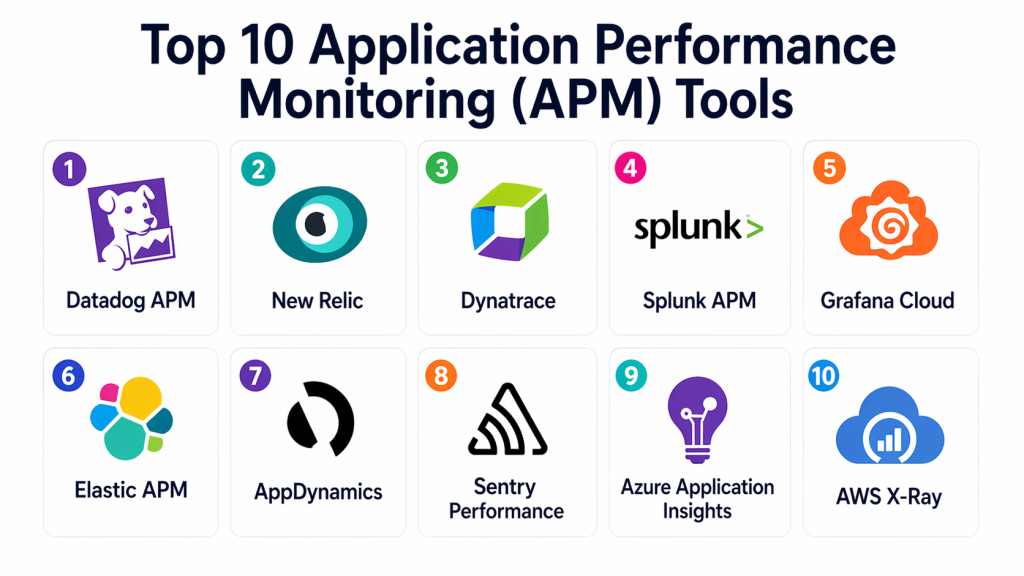
Top 10 Application Performance Monitoring (APM) Tools
#1 — Datadog APM
Short description: Datadog APM is a leading cloud-based platform that provides full-stack visibility across applications, infrastructure, and user experience. It is widely used for monitoring microservices and cloud-native environments with strong correlation between logs, metrics, and traces.
Key Features
- Distributed tracing
- Real-time monitoring dashboards
- Metrics, logs, and trace correlation
- AI-based anomaly detection
- Performance profiling
- Alerting and incident management
Pros
- Comprehensive observability features
- Strong integrations with cloud platforms
Cons
- Expensive at scale
- Learning curve for beginners
Platforms / Deployment
- Web
- Cloud
Security & Compliance
- RBAC, audit logs
Integrations & Ecosystem
Datadog integrates with a wide range of DevOps and cloud tools, making it suitable for modern application stacks.
- Kubernetes
- Cloud platforms
- CI/CD tools
- Databases and APIs
Support & Community
Strong enterprise support with extensive documentation.
#2 — New Relic
Short description: New Relic offers a full-stack APM solution with strong analytics and user experience monitoring. It is well suited for teams looking for an easy-to-use platform with comprehensive visibility.
Key Features
- Application monitoring
- Distributed tracing
- Log management
- Browser and mobile monitoring
- Custom dashboards
Pros
- Easy onboarding
- Strong analytics capabilities
Cons
- Pricing complexity
- Data costs can increase
Platforms / Deployment
- Web
- Cloud
Security & Compliance
- RBAC
Integrations & Ecosystem
Supports integration with modern development and cloud ecosystems.
- DevOps tools
- Cloud platforms
- APIs
Support & Community
Good documentation and community support.
#3 — Dynatrace
Short description: Dynatrace is an enterprise-grade APM platform known for its AI-driven monitoring and automation capabilities. It provides deep visibility across complex environments.
Key Features
- AI-based monitoring
- Distributed tracing
- Root cause analysis
- Infrastructure monitoring
- Real-time insights
Pros
- Strong automation
- Enterprise-grade capabilities
Cons
- High cost
- Complex setup
Platforms / Deployment
- Web
- Cloud / Hybrid
Security & Compliance
- RBAC, audit logs
Integrations & Ecosystem
Works across enterprise and cloud environments.
- Cloud platforms
- DevOps tools
- Kubernetes
Support & Community
Enterprise-level support.
#4 — Splunk APM
Short description: Splunk APM provides high-fidelity tracing and analytics for complex applications. It is ideal for large-scale environments requiring deep insights.
Key Features
- Distributed tracing
- Real-time analytics
- Service dependency mapping
- Log and metrics correlation
- Alerting
Pros
- Powerful analytics
- Scalable
Cons
- Expensive
- Complex configuration
Platforms / Deployment
- Web
- Cloud
Security & Compliance
- RBAC
Integrations & Ecosystem
Integrates with enterprise and DevOps ecosystems.
- Cloud services
- CI/CD tools
- Monitoring systems
Support & Community
Strong enterprise support.
#5 — Grafana Cloud
Short description: Grafana Cloud offers observability and APM features built on open-source technologies. It is popular for its flexibility and visualization capabilities.
Key Features
- Metrics and logs visualization
- Distributed tracing
- Custom dashboards
- Open-source integrations
- Alerting
Pros
- Highly customizable
- Strong community support
Cons
- Requires setup knowledge
- Learning curve
Platforms / Deployment
- Web
- Cloud / Self-hosted
Security & Compliance
- RBAC
Integrations & Ecosystem
Works with open-source and cloud-native tools.
- Prometheus
- Kubernetes
- DevOps tools
Support & Community
Large open-source community.
#6 — Elastic APM
Short description: Elastic APM provides application monitoring integrated with search and analytics capabilities, making it a flexible solution for modern environments.
Key Features
- Distributed tracing
- Log and metrics integration
- Search and analytics
- Visualization tools
- OpenTelemetry support
Pros
- Flexible deployment
- Strong analytics
Cons
- Complex setup
- Requires expertise
Platforms / Deployment
- Web
- Cloud / Self-hosted
Security & Compliance
- RBAC
Integrations & Ecosystem
Integrates with modern infrastructure and data tools.
- Cloud platforms
- DevOps tools
- APIs
Support & Community
Strong community support.
#7 — AppDynamics
Short description: AppDynamics focuses on application performance with business insights, making it suitable for enterprise environments.
Key Features
- Application monitoring
- Business transaction tracking
- Real-time analytics
- Alerting
- Visualization dashboards
Pros
- Strong enterprise features
- Business insights
Cons
- Expensive
- Complex setup
Platforms / Deployment
- Web
- Cloud / Hybrid
Security & Compliance
- RBAC
Integrations & Ecosystem
Works with enterprise systems and cloud platforms.
- DevOps tools
- Cloud services
Support & Community
Enterprise support.
#8 — Sentry Performance
Short description: Sentry combines error tracking with performance monitoring, making it ideal for developer-focused workflows.
Key Features
- Performance monitoring
- Error tracking
- Release tracking
- Real-time alerts
- Debugging tools
Pros
- Developer-friendly
- Easy to use
Cons
- Limited infrastructure monitoring
- Not full observability
Platforms / Deployment
- Web
- Cloud
Security & Compliance
- Not publicly stated
Integrations & Ecosystem
Integrates with development workflows and tools.
- CI/CD pipelines
- Dev tools
- APIs
Support & Community
Strong developer community.
#9 — Azure Application Insights
Short description: Azure Application Insights provides APM capabilities integrated into Microsoft cloud services, ideal for Azure-based environments.
Key Features
- Application monitoring
- Request tracking
- Dependency mapping
- Performance analytics
- Alerting
Pros
- Strong Azure integration
- Easy deployment
Cons
- Limited outside Azure
- Vendor dependency
Platforms / Deployment
- Web
- Cloud
Security & Compliance
- RBAC
Integrations & Ecosystem
Works within Microsoft ecosystem.
- Azure services
- DevOps pipelines
Support & Community
Enterprise support.
#10 — AWS X-Ray
Short description: AWS X-Ray provides distributed tracing for applications running in cloud environments, helping teams analyze request flows.
Key Features
- Distributed tracing
- Service maps
- Performance insights
- Request analysis
- Integration with cloud services
Pros
- Native cloud integration
- Easy to use for AWS users
Cons
- Limited features compared to full APM tools
- AWS dependency
Platforms / Deployment
- Web
- Cloud
Security & Compliance
- IAM-based access
Integrations & Ecosystem
Works with cloud-native services.
- AWS services
- DevOps tools
Support & Community
Strong cloud support.
Comparison Table (Top 10)
| Tool Name | Best For | Platform(s) Supported | Deployment | Standout Feature | Public Rating |
|---|---|---|---|---|---|
| Datadog APM | Cloud-native apps | Web | Cloud | Full-stack monitoring | N/A |
| New Relic | Dev teams | Web | Cloud | Analytics | N/A |
| Dynatrace | Enterprises | Web | Hybrid | AI monitoring | N/A |
| Splunk APM | Large-scale systems | Web | Cloud | Trace analytics | N/A |
| Grafana Cloud | Open-source users | Web | Hybrid | Dashboards | N/A |
| Elastic APM | Flexible setups | Web | Hybrid | Search analytics | N/A |
| AppDynamics | Enterprises | Web | Hybrid | Business insights | N/A |
| Sentry | Developers | Web | Cloud | Error tracking | N/A |
| Azure Insights | Microsoft users | Web | Cloud | Integration | N/A |
| AWS X-Ray | AWS users | Web | Cloud | Tracing | N/A |
Evaluation & Scoring of Application Performance Monitoring (APM) Tools
| Tool Name | Core (25%) | Ease (15%) | Integrations (15%) | Security (10%) | Performance (10%) | Support (10%) | Value (15%) | Weighted Total (0–10) |
|---|---|---|---|---|---|---|---|---|
| Datadog | 9 | 8 | 10 | 9 | 9 | 9 | 7 | 8.8 |
| New Relic | 9 | 9 | 9 | 8 | 8 | 8 | 8 | 8.6 |
| Dynatrace | 9 | 7 | 9 | 9 | 9 | 9 | 7 | 8.7 |
| Splunk | 9 | 7 | 8 | 9 | 9 | 9 | 6 | 8.3 |
| Grafana | 8 | 7 | 9 | 7 | 8 | 8 | 9 | 8.1 |
| Elastic | 8 | 6 | 8 | 8 | 8 | 8 | 8 | 7.9 |
| AppDynamics | 9 | 6 | 8 | 9 | 9 | 8 | 6 | 8.1 |
| Sentry | 7 | 9 | 7 | 7 | 7 | 7 | 9 | 7.8 |
| Azure | 7 | 8 | 8 | 8 | 7 | 8 | 8 | 7.9 |
| AWS | 7 | 7 | 7 | 8 | 7 | 7 | 8 | 7.5 |
How to interpret scores:
These scores are comparative benchmarks based on weighted criteria. Higher scores indicate stronger capabilities, but the best tool depends on your use case. Enterprise tools score higher in depth and security, while open or developer-focused tools offer better value and ease of use. Always test tools in real scenarios before final selection.
Which Application Performance Monitoring (APM) Tool Is Right for You?
Solo / Freelancer
Sentry and Grafana Cloud are good options due to ease of use and lower cost. They provide essential monitoring without complexity. These tools are ideal for small applications and quick debugging. They offer flexibility for individual developers.
SMB
New Relic and Grafana Cloud provide a balance between features and usability. They are easy to adopt and scale as the business grows. SMB teams benefit from their flexibility and strong integration support. These tools offer good value.
Mid-Market
Datadog and Elastic APM provide strong capabilities for growing teams. They support complex environments and integrate well with DevOps workflows. These tools help manage increasing infrastructure complexity. They are ideal for scaling organizations.
Enterprise
Dynatrace, Splunk, and AppDynamics are best for large organizations. They offer advanced analytics, automation, and scalability. Enterprises benefit from their robust features and compliance capabilities. These tools handle complex systems effectively.
Budget vs Premium
- Budget: Grafana Cloud, Sentry
- Premium: Datadog, Dynatrace
Feature Depth vs Ease of Use
- Easy: New Relic
- Advanced: Dynatrace
Integrations & Scalability
Choose tools that integrate with cloud platforms and CI/CD pipelines. Scalability is essential for handling large systems. Ensure the platform supports distributed architectures. Integration flexibility is critical.
Security & Compliance Needs
Prioritize tools with strong access control and audit features. Compliance requirements vary by industry. Tools with monitoring and reporting capabilities provide better governance. Security visibility is essential.
Frequently Asked Questions (FAQs)
1. What is APM?
APM stands for Application Performance Monitoring. It helps track application performance and detect issues. These tools provide visibility into system behavior. They are essential for modern applications.
2. Why is APM important?
APM helps identify performance issues and reduce downtime. It improves user experience and system reliability. Teams can troubleshoot problems faster. It is critical for business applications.
3. What are the components of APM?
APM includes metrics, logs, and traces. These components provide a complete view of application performance. They help diagnose issues effectively. Together, they improve observability.
4. Can APM tools integrate with DevOps?
Yes, most APM tools integrate with DevOps pipelines. They support CI/CD workflows and automation. This improves deployment visibility. Integration enhances efficiency.
5. Are APM tools expensive?
Costs vary depending on features and usage. Enterprise tools can be expensive. Open-source options provide cost-effective alternatives. Teams should evaluate based on needs.
6. Do APM tools support cloud environments?
Yes, most APM tools support cloud-native environments. They work with multi-cloud and hybrid systems. This ensures visibility across infrastructure. It is essential for modern applications.
7. How difficult is implementation?
Implementation varies by tool. Some tools are easy to set up, while others require expertise. Proper planning helps simplify the process. Starting small is recommended.
8. Can APM improve performance?
Yes, APM helps identify bottlenecks and inefficiencies. Teams can optimize systems based on insights. This improves application performance. Continuous monitoring ensures stability.
9. What are common APM challenges?
Challenges include data overload, cost, and complexity. Managing large volumes of data can be difficult. Proper configuration helps address these issues. Choosing the right tool is important.
10. What are alternatives to APM tools?
Alternatives include basic monitoring tools and manual debugging. However, these approaches lack depth. APM tools provide comprehensive insights. They are essential for modern systems.
Conclusion
Application Performance Monitoring tools are essential for maintaining reliable, high-performing applications in modern environments. They help teams detect issues early, reduce downtime, and improve user experience. As systems become more complex, APM tools provide the visibility needed to manage performance effectively. While platforms like Datadog and Dynatrace offer advanced enterprise capabilities, tools like Grafana Cloud and Sentry provide flexibility and cost efficiency. The best choice depends on your infrastructure, team size, and requirements. Start by evaluating your needs, test a few tools, and choose the one that aligns with your operational goals.